Friday, October 9, 2009

Activity 19 - Restoration of blurred image


In this activity, we are tasked to perform restoration algorithm to motion blurred images with additive noise.

Model
Degradation process is modeled as a degradation function (see figure below), together with an additive noise, applied to an input image.


The blurring process is taken as the convolution of the degradation function h(x,y) with the input image f(x,y). With the addition of noise, the output image becomes:

g(x,y) = h(x,y)*f(x,y) + η(x,y)

We take the Fourier transform (FT) of the output function which results to a simple algebraic form:

G(u,v) = H(u,v)F(u,v) + N(u,v)

Now, the degradation transfer function H(u,v) is given by:

H(u,v) =[T/π(ua+vb)] sin [π(ua+vb)]e-(ua+vb)

where a,b are the displacement of the image along the x and y direction, T is the exposure time of the capture (shutter speed).

Below is an example of an blurred image (a = 0.1, b = 0.1, T = 1) with an additional Gaussian noise (μ = 0.01,σ = 0.001).


Figure 1. (a) Image of Hilary Duff[3] and (b) the blurred image using a = b = 0.1, T = 1

In restoring blurred images, we use the Minimum square error (Weiner) filtering. This technique incorporates the degradation function (blurring process) and the noise to reconstruct a corrupted image (f) and finding an estimate f ^ such that, as the name implies, the mean square error between them is minimum. The best estimate of the image in the frequency domain is given by:


where Sη = |N(u,v)|2 (power spectrum of the noise) and Sf = |F(u,v)|2 (power spectrum of the undergraded image).
Using the above equation, we demonstrate the following restorations at various exposure times (T) and motion blur displacements (a,b).


Figure 2. Restored images (down) increasing motion displacements a = b = 0.01, 0.1, 1 and (from left) increasing T (0.1, 1, 5, 10 and 50).

From the figure, we observed that increasing T results to a better restoration of the image. As previously mentioned, T is the exposure time of capture. It measures the amount of light coming into the sensor of an imaging device. This is the reason why we notice that images using small T tend to be relatively darker than when using larger T. Moreover, T also affects how movements appear in a picture[2]. Less Ts are intended for freeze fast moving objects, such as in sports. High Ts, on the other hand, are intended for intentional blurring of images for artistic purposes[2]. Our results suggest that higher T renders better image restoration. At these values, we gain more information of the blurring process; thus we are able to have improved estimate of the original image.
Also, as seen from the figure, the quality of the restored image decreases with increasing motion blur displacements. As expected, increasing the values of a and b enhance the blur resulting to an inevitably poor restoration of the image.

Most of the time, given an image regardless as being blurred or not, we do not have an idea of the distribution of the noise contained in that image. Hence, the equation above cannot be solved if we do not know the power spectrum of the noise. We thus approximate the equation by replacing the last term of the denominator with a specified constant K (shown below).


We explored on the effect of the value of K to the quality of the restoration. The figure below shows the restored images as K varies. As seen, the restoration quality decreases with K. From the equation above, K replaces the ratio Sη/Sf (the ration of the spectrum of noise and the spectrum of the undergraded image). K determines the relative degree of noise with respect to the image. The choice of higher values of K comes with the assumption that the image contains a high degree of noise. Hence, increased K (K higher than the actual Sη/Sf) implies lesser possibility of rendering a good result.


Figure 3. Restored images (down) increasing motion displacements a = b = 0.01, 0.1, 1 and (from left) increasing K (0.00001, 0.001, 0.1, and 10).

Note: Most of the results presented were qualitatively described i.e, the qualification of a good or bad quality of the images is subjective. A better and meaningful presentation of the results is to take the Linfoot's criterion (FCQ) as a qualifier and plot it with the parameters a,b, K and T.

In this activity, I give myself a grade of 10 for performing the activity well.

I thank Kaye, Irene and Mark Jayson for useful discussions.

References:
[1] Applied Physics 186 Activity 19 manual
[2] http://en.wikipedia.org/wiki/Shutter_speed
[3] http://www.smashingapps.com/wp-content/uploads/2009/04/grayscale-technique.jpg
Thursday, September 24, 2009

Activity 18 - Noise model and basic image restoration


Several factors affect the quality of a digital image. For one, the lenses of the camera, especially for single-lens cameras, distort the captured image. In our previous activity, we performed image processing techniques to correct such distortions. Aside from distortion, noise which is random variation of brightness and color information of images[2], also cause undesirable degradation to the captured image that usually arises during acquisition. For instance, temperature which alters the response of a camera sensor affects the amount of noise in an image[1]. In restoring such images, we use our knowledge of the degradation phenomenon, model it and perform an inverse process in order to recover the image.

Noise are composed of random variables characterized by certain probability distribution function (PDF)[1]. In this activity, we explore on most common noise models found in image processing applications as well as some basic noise-reduction filters used in image restoration.

Noise Models

Gaussian noise:
p(z) = (1/√ 2πσ )e-(z-μ)2/2σ2

Rayleigh noise:

p(z) = (2/b)(z - a)e-(z-a)2/b for z > a else p(z) = 0

Erlang (Gamma) Noise:
p(z) = [abzb-1/(b-1)!] e-az for z > a else p(z) = 0

Exponential Noise:
p(z) = ae-az for z > a else p(z) = 0

Uniform Noise:
p(z) = 1/(b-a) if a < z < b else p(z) = 0

Impulse (salt an pepper) Noise:
p(z) = Pa for z = a
p(z) = Pb for z = b
p(z) = 0 otherwise

The figure below demonstrates the effect of each noise PDF to an image. Here we initially observe a grainy effect of the noise.


Figure 1. (left) Original image and (right) the image added with (clockwise from upper left) Gaussian, gamma, exponential, Rayleigh, uniform and, salt&pepper noise.

From the original grayscale value histogram of the image (shown in Figure 2), upon application of the noise to the image, the histogram was transformed as in Figure 3.


Figure 2. Grayscale value histogram of the image


Figure 3. Histogram of grayscale values from the generated noisy images: (clockwise from upper left) Gaussian, gamma, exponential, Rayleigh, uniform and, salt&pepper noise.

Basic noise-reduction filters

These filters takes a window Sxy in an image with center x,y and perform averaging.
Arithmetic mean filter (AMF)


Geometric mean filter (GMF)


Harmonic mean filter (HMF)


Contraharmonic mean filter (CMF)

CMF is good in removing salt&pepper noise. If Q>0, it removes pepper noise. If Q<0, it removes salt noise.

Restoration

We have tested the effect of the window size to the quality of the reconstructed image. The figure below shows the reconstructed images using the four filters for sizes of Sxy = {3x3, 5x5, 9x9}. We observe that smaller window size resulted to a relatively grainy restoration than with that of larger window size. On the other hand, large window size resulted to a more blurry image. In the following reconstructions, we used a window size of 5x5.


Figure 4. Reconstructed image of Gaussian-noised image using (from top to bottom) AMF, GMF, HMF and CMF (Q= 1) at different window sizes (left to right) 3x3, 5x5, 9x9.

Here we show the effects of the filters to the noised images.


Figure 5. (right)Reconstruction of (left)noisy images: (top to bottom) Gaussian, gamma, exponential, Rayleigh, uniform and, salt&pepper noise using (from 2nd column to the right) AMF, GMF, HMF and CMF (Q=1).

From Fig. 5, we see that for all noised images, the AMF produced a consistent results although may not be the best result. This technique can thus be use generically for noisy images. GMF also produced a very good restoration for all noised images except for the salt&pepper-noised image. HMF is also resulted to a good reconstruction except for Guassian and salt&pepper-noised images. CMF (Q= 1) produced a good result except for exponential and salt&pepper-noised image. Salt&pepper-noised image was harder to restore compared to others. Moreover, we see that CMF (Q=1) was not able to correctly restore a salt&pepper-noised image, as previously said. Now we demonstrate the effect of CMF to salt-only and pepper-only-noised image.

Figure 6. Image reconstruction of Q = 1 and Q= -1 CMF for (top to bottom) the image with salt and pepper, salt-only and pepper-only noise. CMF cannot properly reconstruct a salt& pepper-noised image. Salt is removed when Q is negative. Pepper is removed when Q is positive.

We indeed see that CMF can perfectly restore images with salt noise and pepper noise alone.


Figure 7. Test image taken from [3]

Below are reconstructions of noised images using (from upperleft clockwise) AMF, GMF, CMF, and HMF.


Figure8. Reconstruction of a Gaussian-noised image.


Figure 9. Reconstruction of a gamma-noised image.


Figure 10. Reconstruction of a exponential-noised image.


Figure 11. Reconstruction of a Rayleigh-noised image.


Figure 12. Reconstruction of a uniform-noised image.


Figure 13. Reconstruction of a salt&pepper-noised image.

In this activity, I give myself a grade of 10 for finishing it well.
I thank Irene, Janno, Martin, Master, Cherry for the help.

References:
[1] AP186 Activity 18 manual
[2] http://en.wikipedia.org/wiki/Image_noise
[3] http://bluecandy.typepad.com/.a/

Tuesday, September 8, 2009

Activity 17 - Photometric Stereo


Objects appear different depending on where the light source illuminating it is located. Shadows form at different locations. In this activity, we demonstrate a shadow model and extract shape from the shadows. Models depend on the type light source (point source, line source, etc.) used and where the light source is located. One of the more simple model is when the light source is placed at infinity.
In general, when the light source is nearby, the brightness of an object illuminated by it is given by:

B(P) = [ρ(P)n(P)•S(P)]/R(P)2

where B(P) is the brightness of the object, S(P) is a vector from the light source and R(P) is the distance of the light source from the object.
In an infinite light source, 1/r dependence of B(P) disappears and the vector S(P) becomes constant for every point in the object. Thus the equation becomes:

B(P) = ρ(P)n(P)•So

In capturing an image of an object, we assume that it is proportional to the brightness of the object:

I(x,y) = kB(x,y) = kρ(x,y)n(x,y)•So = g(x,y)•Vo

where g(x,y) = ρ(x,y)n(x,y) and Vo=kSo.
When an object is illuminated by light N light sources, Vo takes the form:


Each row represents the position (x,y,z) of the source in 3D space. Given an image with its intensity equal to its grayscale value, we can determine g(x,y) using the equation above. If we took a N captures of the surface of object illuminated by N light sources, then for each point (x,y):

I1(x,y) = V11g1 + V12g2 + V13g3
I2(x,y) = V21g1 + V22g2 + V23g3
IN(x,y) = VN1g1 + VN2g2 + VN3g3

or in matrix form:
I = gV

Since we know I and V, we can calculate g using:

g = (VTV)-1VI

The normal vector can be solved by:


To get the surface elevation of point (u,v) on the surface, we use:


where


In this activity, we captured four images of a hemisphere illuminated by a far away light source located at four positions V:

(0.085832, 0.17365, 0.98106)
(0.085832, -0.17365, 0.98106)
(0.173650, 0.0, 0.98481)
(0.163180, -0.34202, 0.92542)

Below are the images taken for each light source locations.


Figure 1. Images of a hemispheres illuminated by a light source located at different positions

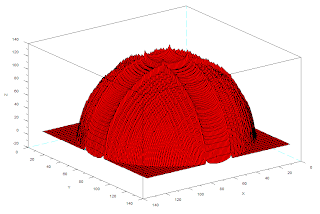
Using the procedure above, we obtained a 3D image of the surface shown in Fig.2.


Figure 2. 3D reconstruction of the hemisphere

Here, we have successfully reconstructed the image. The reconstruction, however, is not smooth. Some parts do not follow the contour of a hemisphere.

In this activity, I give myself a grade of 10 for a successful reconstruction of the surface.

I thank Irene, Alva, Orly for very very useful help. :)


Activity 16 - Neural Networks


In the previous activities, we have used Euclidean distance and LDA as classifiers for pattern recognition. In this activity, we tried the neural networks. A neural network is a computational model of how neurons in the brain works. Basically, just as the brain does pattern recognition, the neural network is fed with features of known patterns; in which case, it "learns" the rules for classification from the input it receives.
Just as the neurons pass electrical signals to other neurons, this model (McCoulloch, Pitts 1943) essentially works the same way. With input signals xi, (see Fig.1) a neuron receives weighted inputs(wi*xi) and lets the sum of all the signal it receives act on an activation function g. The resulting signal z is then passed to other neurons[1].


Figure 1. Artificial neuron

The same process takes place as the signal is passed from neuron to neuron. This network of neurons is called the neural network.


Figure 2. Neural Network

The neural network is composed of an input layer, a hidden layer, and the output layer. The input layer receives the signal (features) which is passed onto the hidden layer. The hidden layer then passes it to the output layer[1].Justify Full

Results
Using a code originally written by J. Tugaff [2], we use neural network to classify objects as 1-peso coin, 25-cents coin, long leaf, short leaf or flower using r-g chromaticity and dimension ratio (length/width) as features. (Code needs modification depending on the number of classes and features used.)

Learning process
As training , we used the features of 5 samples/class as inputs to the neural network. It is trained such that it outputs: [1 0 0 0 0] for 1-peso coin, [0 1 0 0 0] for 25-cents coin and so on.


Figure 3. Plot of the distinguishing capability of the neural network with (left) learning rate and (right) training cycles T.

Before the classification, we checked the distinguishing capability (the ability to properly separate classification from other classes)of the neural network as a function of the learning rate and training cycles T. We checked it by using the training set as our test set. We took the average value of the "supposedly 1" outputs. Fig.3(left) shows the average against learning rate. An increasing trend is observed. As learning rate increases, the output approaches to 1 thus the network is able to classify the objects properly. We also observed an increasing trend when T increases. High T improves learning process resulting to better classification.
Based on these results, it is quite a good idea to choose learning rate and T as high as possible. However, this is very time-consuming to do. This will slow down the learning process which makes it impractical.1 For our case, we use T = 5000 and learning rate = 1 for training.
After training, we tested the training set to verify that the network has "learned". The result of classification is summarized on the table below.

Table 1. Classification of the training set used in the learning process of the neural network.


Here we see that the network is able to identify properly identified the training set hence the network has already learned, we can now use it to classify our test objects.

Classification of test objects
In the table below, we show the result of classification of the test objects. Here, we have achieved a 96% correct classification.

Table 2. Classification of test objects using the neural network


1 If one, on the other hand, is willing to wait for better results, he might as well choose higher learning rate and T.

I thank Master, Kaye and Thirdy and Irene for very useful help.

I give myself a grade of 10 for doing a good job.

References:
[1] Applied Physics 186 Activity 16 manual
[2] http://cole-ap186.blogspot.com/

Monday, September 7, 2009

Activity 15 - Probabilistic Classification


In the previous activity, we tried to classify objects into classes based on a set of features that describe the objects. Particularly, we used the Euclidean distance as a classifier for our dataset. In this activity, on the other hand, we use another classifier called the Linear Discriminant Analysis (LDA). Discriminant analysis is a statistical approach in pattern recognition. LDA assumes that the classes of objects are linearly separable (as the term linear applies)-- meaning, the classes of objects can be separated by linear combination of features that describe the object[1]. The LDA formula is given by:

fi = uiC-1xkT - 1/2uiC-1uiT + ln(pi) .

where ui is the mean features of the class i, C is the covariance matrix obtained from the training set, xk is the features of test kth test object, and pi is the prior probability of a class i.

Mean Features of a Class
Given features of a set of test objects of the classes 1 and 2, (in this case, we have 3 test objects and 2 features for class 1)

x1 = [ao bo; a1 b1; a2 b2] and x2 = [co do; c1 d1]

mean feature of class 1 is calculated as:

u1 = [mean(ao,a1,a2) mean(bo,b1,b2)]

Covariance Matrix
From the features of the whole training set (contains all training samples of all classes), one can calculate the global mean vector. This is essentially the mean features of the whole training set.
For example, given a data set

x = [ao bo; a1 b1; a2 b2; co do; c1 d2] ,

the global mean vector is given by

u = [mean(ao,a1,a2,co,c1) mean(bo,b1,b2,do,d1)]

From the u, we can solve the mean corrected data xio for each class i

xio = xi -u .

The covariance matrix of a class i is:

ci = [(xio)Txio]/ni

where ni is the number of test samples used for class i.
The covariance matrix of the whole test set is then solved using:

C = 1/n Σ nici

where n is the number of samples in the whole data set.

Prior Probability
The prior probability of class i is given by:

pi = ni/n .


Results

We used the LDA formula in classifying objects in our data set. The object k is classified as belonging to class i if it resulted the highest f at i. Below is the result of our classification. Highlighted values are the maximum fi obtained per sample. Samples are classified according to i where highlighted values occur.

Table 1. LDA results of 5 test samples of 1-peso coins,25-cent coins, long leaves, short leaves and flowers.


Based on the table, we were able to get a 92% classification of objects.

In this activity, I give myself a grade of 10 for understanding ang implementing properly LDA.

I thank Mark Jayson and Luis for happy conversations while doing the activity in the IPL lab.

References:
[1]http://people.revoledu.com/kardi/tutorial/LDA/Numerical%20Example.html

Monday, August 31, 2009

Activity 14 - Pattern recognition


The human brain has the capacity to discriminate from one object to another. From the stigma it receives from the eyes (-or from other sensory organs), one of the things that human does is to find significant features unique to the objects and draw,as well, overlapping features between different objects that will allow to recognize things. The aim of computer vision is to approximate the pattern recognition capabilities of the human brain. Various features can be found in a certain object or pattern -- color, size, shape, area, etc. We use such features to identify an object as a member of a set that has the same properties (this set is called a class).
In this activity, we are tasked to classify objects according to their classes using their physical features. We should be able to (1) find the correct features that will effectively separate the classes and (2) create a classifier (or an algorithm) that is suitable for the task.

In Task 1, we determine the useful features and train a representative set of objects of known class and calculate the feature values (for example, area). An average value per feature is taken from the whole class.

where mj is the average for all feature xj of class wj. It is a 1xn matrix for all features n. These average values will be used as the basis for classification. In our case, we used the r-g chromaticity (discussed in Activity 12)and dimension ratio (length/width) as features for the set of classes we gathered (image is shown below).


Figure 1. Dataset of classes used that contains a set of short and long leaves, flowers, and 25-cent and 1-peso coins.

Once the mj for all the classes are done, we are now ready to classify a test object based on its features. We extract all the needed features x and determine what class it belongs to. For Task 2, we used the Euclidean distance as a classifier for our test objects. It is given by:

dj(x) = xTmj - 1/2 mjTmj

This determines how close the features x of an object to the features of class j. The object will be classified as belonging to a class which yields the largest dj.

Results

Below is 3D plot of features extracted from the objects in our dataset. We readily see an obvious separation of class clusters of the leaves (short and long) and of the flowers. One reason is that the color of the flower is different from the color of the leaves. The difference in the dimension ratio of the short leaves and long leaves has also separated the two leaf types. However, class clusters of the coins were not well separated. Based on the criteria used, the dimension ratio cannot possibly separate the two since both are circular (dimention ratio ~ 1). Only the color determined by the r-g chromaticities will be able to separate them.


Figure 2. Separation of class clusters using the r, g and dimension ratio as features

We take a look at the distribution of points using only the r-g chromaticities -- Fig.1 as viewed from the above. Here, we see that there is an overlap between the clusters of 1-peso and 25-cent coins. In r-g chromaticity diagram (see Fig. 3 in Activity 12), the color yellow and white, which are the colors of the 25-cents and 1-peso, respectively, lie close to each other. It is thus expected that the clusters be consequently close. The overlap is caused by the highly reflective surface of the coins. In our case, a 25-cent coin is misidentified as a 1-peso coin. Highly reflective 25-cents (the new ones) will appear as though it is a 1-peso coin.


Figure 3. r-g chromaticities of the samples. A single data point overlap of the between two clouds of data points -- cloud of peso coins (inverted triangle) and 25 centavo coins (filled diamonds) is seen indicating that the r-g chromaticity wrongly classifies a 25-cent as a 1-peso coin.

From the plots, we can already observe whether the features we used is capable of classifying objects. However, this can only be handy when dealing with at most 3 features. More than this will be very hard to visualize. The advantage of a classifier such as the Euclidean distance is that it essentially decomposes all the features into one number, thereby resulting to easier classification of objects. Below is a table of test objects and there classification using the algorithm.

Table 1. List of Euclidean distances of the samples from the training set. Sample x - i are samples taken from a set of samples i where i = {peso, 25 cents, long leaf, short leaf, flower}.

Align Center

Values highlighted with yellow belong to the column where the samples are classified. For example, Sample 1-1 resulted the highest value at dpeso hence classified as a 1-peso coin. All the classifications were correct except for one sample. This is a 25-cent coin wrongly classified as a 1-peso coin. The features used are 96% accurate in classification.
Note that the features used are not enough to completely separate the classes of coins. One can use the area as a feature to be able to do such.

In this activity, I give myself a grade of 10 for doing the job well.

I thank Luis, Mark Jayson and Irene for useful discussions. Especial thanks to Mark Jayson, Irene and Kaye for lending the dataset.

Activity 13 - Correcting Geometric Distortion


Digital images captured by cameras, most of the time, are different from the one we see with our eyes -- although some are unrecongnizable. The color for example is altered by the spectral sensitivity and white balance settings of the camera. Another factor that contributes to these differences is the distortion it adds to the captured image due to its lens configuration. Pincushion and barrel distortions are observed in spherical lenses. In pincushion distortion, the image seems pinched in the middle and expanded in the boundaries. In barrel distortion, the image seems bloated in the middle and pinched at the sides *[1]. Below are images that demonstrates the two distortions.


Figure 1. (left) Pincushion and (right) barrel distortion of a square grid

Cameras using compound lenses have considerably minimized these effects. Single lens cameras render a much more obvious distortion.
In this activity, we are tasked to correct distorted image. We download an image from the net with distorted grid patterns. The idea is to perform an image processing technique to make straight lines look straight.

Steps in correcting a distorted image:
1. Find the image coordinates the four corners of a square where the effect of the distortion is small. Usually, this can be found at the center of the image or at the optical axis of the camera.

2. Create an ideal grid from the obtained coordinates. (The grid only contains corner points.)

3. Calculate c's from the corner points using the equation below to be able to transfer distorted image coordinate to the ideal image coordinates.(c's are unique to a specific square)

(x,y) is from the ideal image coordinates, (x,y) is from the distorted image coordinates. The c's allow us to determine the location of a pixel from the ideal image to the distorted image.

4. Transfer grayscale values.
  • Nearest neighbor technique: In determining the distorted image coordinates that correspond to the ideal image coordinates (using the c's), cases may occur that the calculations would yield non-integer coordinates. In the simplistic case, one can round the coordinates, then the grayscale value of the that pixel will be transferred to the ideal image. The advantage of this is that it is fast, although the reconstruction is pixelated and jagged.
  • Bilinear interpolation: If the location of the pixel from the ideal image corresponds to integer distorted image coordinates, pixel values from the distorted image can be directly transferred to the ideal image. If not, we use the equation below:

a, b, c and d can be calculated using the surrounding pixels of the pixel with non-integer coordinates.

Results

In this work, we demonstrate the two techniques used in the correcting distorted images as well as the other application of the techniques.


Figure 2. Distorted grid (above) and the corrected image (below)

The above figure consist of the distorted grid and the corrected grid. In this particular example, the nearest neighbor technique was used. We can see that this technique can fairly reconstruct the image. The 'jagged' effect of the technique is less manifested because of the thick lines of the grids.

Note: In this work, the distorted image coordinates of the corner points were determined using the locate function in Scilab. Given a very large grid, this procedure is very tedious and time-consuming. Alternatively, one can perform image processing techniques to determine the coordinates. However, when given a real distorted image as in Fig.3, locate is much more convenient to use since it would be harder to separate the grid lines.

The procedure can also be applied to distort an image. Here's how it's done.
We have a very good, undistorted image. We overlay a distorted grid to the image. Then we perform the same procedure as done previously. In this particular case, we use the bother technique, bilinear interpolation to reconstruct the image.Below is the image and its distortion.


Figure 3. (above) image and (below) its distortion

Here, we observe the success of the procedure. We have straightened the straight lines and were able to distort the image. Image distortion will be highly appreciated if the pixels from the ROI is contained in obviously distorted grids.

I give myself a grade of 10 fro exploring to the two techniques and the possible application of the procedure.

I thank Mark Jayson, Luis and Orly for useful discussions.


References:
[1] Activity 13 manual
[2]http://upload.wikimedia.org/wikipedia/en/9/97/Pincushion-distortion.jpg
[3]http://upload.wikimedia.org/wikipedia/commons/thumb/6/63/Barrel_distortion.svg/600px-Barrel_distortion.svg.png
*Sentences are stated vervatim.

Wednesday, August 5, 2009

Activity 12 - Color Image Segmentation


From the previous activities, we find that thresholding is indeed a powerful way in separating our region of interest with the rest of the image. This technique, however, has its limitations. Thresholding can only be applied to images with single-value pixels such as grayscale images. When dealing with colored images (where each pixel has 3 values -- RGB), one has to reduce it first to grayscale before thresholding. Upon reduction, different colors may appear the same in grayscale. As such, separation of the ROI may not be possible just by thresholding. In this activity, we perform another technique for ROI separation in colored images -- color image segmentation.
Colored images may have different shades (or brightness) of colors inherent to it. Thus, it is better represent the image into brightness and chromaticity information. This is called the normalized chromaticity coordinates (NCC).

Transforming RGB to NCC
Per pixel, we add up the RGB values I = R+G+B. The NCC is then:
r = R/I
g = G/I
b = B/I
Note that b is also equal to 1-r-g hence only the r and g values are needed to represent the chromaticities r,g and b. We essentially have transformed RGB to rgI values where I accounts for the brightness of the pixel.

Two techniques will be used in this activity - parametric and non-parametric segmentation.

Parametric segmentation

In parametric segmentaion, we crop a portion of the ROI and take the mean and standard deviation for the chromaticities r and g. To check whether a pixel belongs to the ROI, we check its probability of belonging to the ROI. Since pixel has two chromaticities, we calculate the effective probability

p = p(r)*p(g)

where p(r) and p(g) are the probabilities of a pixel with chromaticities r and g, respectively belongs to the ROI. We now assume a Gaussian function using the calculated mean and standard deviation for each chromaticity such that the probabilities p(r) and p(g) takes the form:


where x is the r-g chromaticity of the pixel.
The result of the whole process is a martix of p values the same size as the image. High values of p will only occur at ROI and thus we effectively separated the ROI from the rest of the image. Below are examples of the results using this method.


Fig.1 (upper left) the raw image and (rest) the segmented images of red, yellow and blue patches.


Fig.2. (left) the raw image ang (right) the segmented image using parametric segmentation

Here we see a complete segmentation of the ROI.

Non-parametric segmentation

This technique does not assume any form of function unlike the previous one. What is need is just the 2D chromaticity histogram of a portion of the ROI. (Note that the axes are the r and g chromaticities in different levels). In creating the histogram, binning is important because it will determine the quality of the segmentation. If bin sizes are small the details of the ROI is preserved but the toleration of the technique in terms of chromaticity would be very low which results to dark regions in the ROI. If on the other hand, the bin sizes are large, the toleration becomes high such that most of the pixels in the ROI is bright but we compromise its details. Our choice of bins depends on what we want. In this particular case, we used a bin size equal to 256, 32 and 10 to demonstrate their reconstuction differences. Once the histogram is created, we now back-project the chromaticity values of each pixel in the image to the histogram. Steps of backprojection is shown below.


Figure 3. Verification of the histogram

Before the backprojection, we first verify if the peak of the histogram corresponds to its color in the chromaticity space. The patch used is yellow. We observe that the peak coincides to the yellow region.

  • Histogram backprojection
    • Obtain the chromaticity (r,g) values of each pixel in the image.
    • For each pixel, find its position (r,g) on the histogram and find its value.
    • The value at the pixel location is changed to the histogram value found.

In this technique, we can infer that high values will be obtained when the (r,g) values of the pixel in the image corresponds to the (r,g) where high values occurred in the histogram. Shown in Fig.3 is the result of this technique.


Figure 4. (clockwise from upperleft): the raw image and the sementated images using (1) 256 bins, (2) 10 bins and (3) 32 bins in the histogram. (Note that large bins correspond to small bin sizes).

In Fig.4, we indeed see that the segmentation quality differs at different bin sizes. This technique is much better than the previous one since it does not any assumptions. The only challenge is that one should be able to find the proper bin sizes depending on what he wants.

In this activity, I give myself a grade of 9/10 for doing a good job.

I thank Ma'am Jing for helping me get through some problems encountered in this activity.